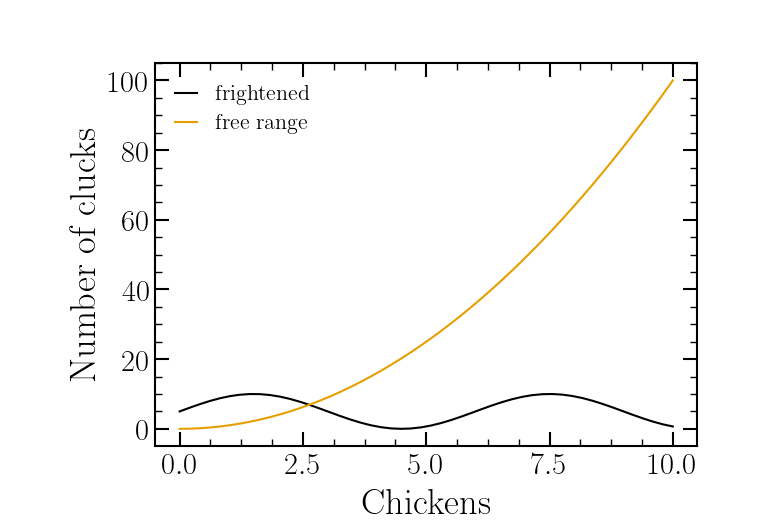

You can customize your plots using matplotlib in a few ways: in code (verbose), a matplotlibrc file (better), or a matplotlib style sheet (best)! The matplotlibrc and mplstyle have the exact same syntax but the difference is how they are used. Matplotlibrc is read at runtime and active for any of the plotting commands. Using the mplstyle requires the use of the command
>>> matplotlib.pyplot.style.use("mystylename")
This must be executed before any plots commands. Matplotlib styles allow you to change the format of a plot is easily without adjusting any inline code—just call the style.use command—useful when publishing to various journals.
You can define your own matplotlib style sheet as <filename>.mplstyle and store it in the <mpl_configdir>/stylelib/ directory. You can download the physrevB.mplstyle I have defined here.
You need to create the stylelib directory manually.
Below is an example for *BSD/Linux/macOS, assuming you downloaded the physrev.mplstyle file to /home/username/downloads. Other
$ python -c "import matplotlib; print(matplotlib.get_configdir())"
/home/username/.matplotlib
$ mkdir /home/username/.matplotlib/stylelib
$ cp /home/username/downloads/physrev.mplstyle /home/username/.matplotlib/stylelib/
If you are using Windows and the anaconda python distribution, you just need to use the Anaconda Terminal to execute
$ python -c "import matplotlib; print(matplotlib.get_configdir())"
After you can navigate to there using Windows Explorer, and copy/create the files you need.
The above assumes your using Python >= 3.0. If you are using Python 2.7.x replace
print(matplotlib.get_configdir())with
print matplotlib.get_configdir()
Once you have copied my style files into the correct location you can set all the plotsto use the style as such,
    import matplotlib.pyplot as plt
    import numpy as np

    plt.style.use('prb')
    # You can have styles that cascade to change *some* options.
    # Example: using the 'prb' style as a base, the 'slide' style is used for
    # presentations and changes the font and figure dimensions.
    plt.style.use('slide')

    x = np.linspace(0, 10)
    y_free = x**2
    y_fright = 3*(np.sin(np.pi*x/3)+1)

    plt.plot(x, y_fright, label='frightened')
    plt.plot(x, y_free, label='free range')

    plt.xlabel('Chickens')
    plt.ylabel('Number of clucks')

    plt.minorticks_on()
    plt.legend()
    plt.show()

NB I have noticed some computers have issues with latex fonts. Ensure your fonts cache for matplotlib is up to date. If you want to use physrevB.mplstyle without latex fonts then comment out the line text.usetext: true or in code do the following:
from matplotlib import rcParams
rcParams['text.usetex'] = False
If you are working with other group members in a git repository (svn, hg, cvs). You can include the style in the folder structure somewhere and just reference it as a reference, but you have to include the .mplstyle in the style.use call. Such that, lets say you have a script folder called python, you can put it there and all scripts can reference it from it’s relative position.
    import matplotlib.pyplot as plt
    import numpy as np

    plt.style.use('./prb.mplstyle')
    ...
This way people don’t need to fight moving files around outside of the project.
This is handy if you save figures as svg’s, you can go in and post edit things easily, or just use the colours for your own figures. You can download the palette and copy it to the inkscape palette directory. On unix systems that is ~/.config/inkscape/palettes, then restart inkscape if open already. On the bottom right of inkscape, where the colors can be chosen, you can change the palette with the arrow, then select POV: Color Blindness, which is named after the paper this palette ordering is based on.
NB .gpl file extension is a Gimp Palette extension, just a plain textfile you can edit and reorder.
© 2017–2024 David Kalliecharan